Investigate RUM sessions
A guide to assist you with drilling into your RUM data.
When analyzing your RUM performance metrics, you will often have the need to drill down into a subset of the data. This is extremely useful when trying to diagnose 'what changed' or to understand the make up of a given cohort users.
Step 1: Navigate to the Sessions dashboard
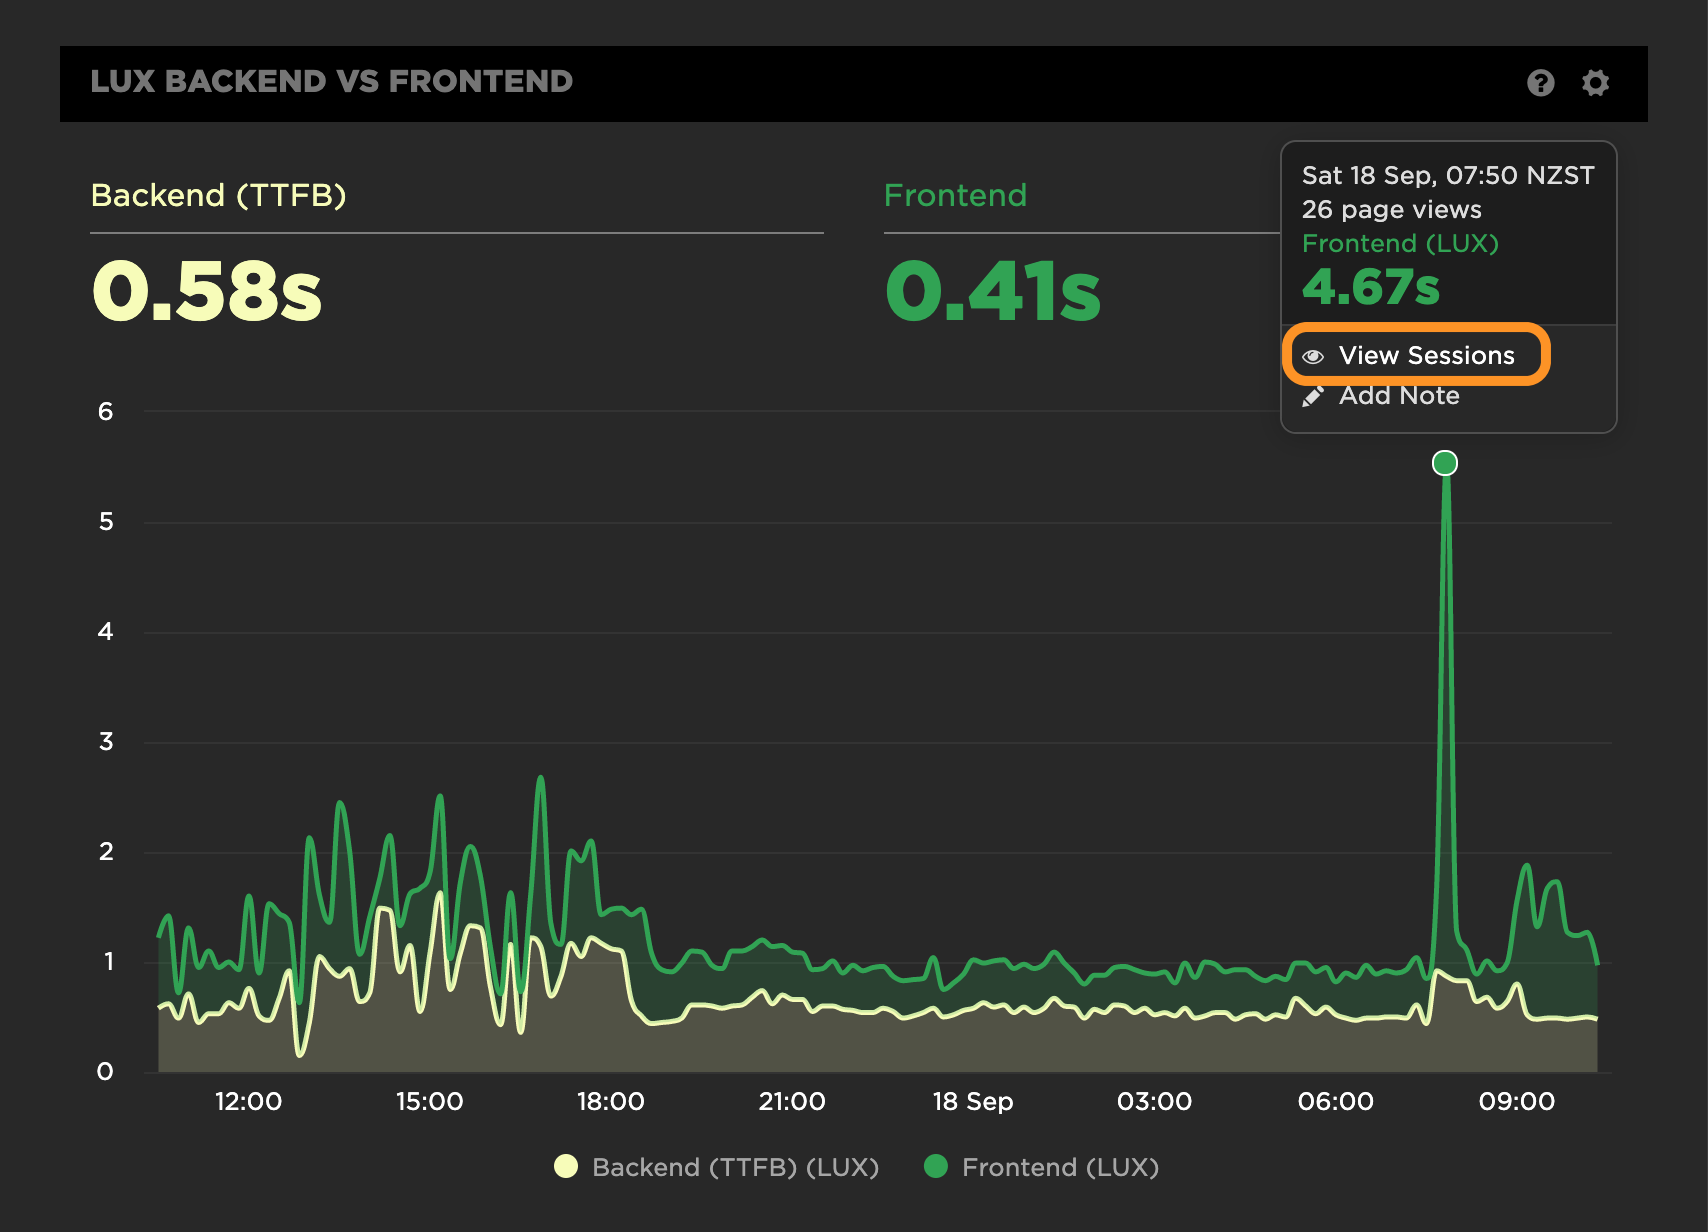
From any RUM dashboard, click on a point in your time series chart to see the option to 'View Sessions'.
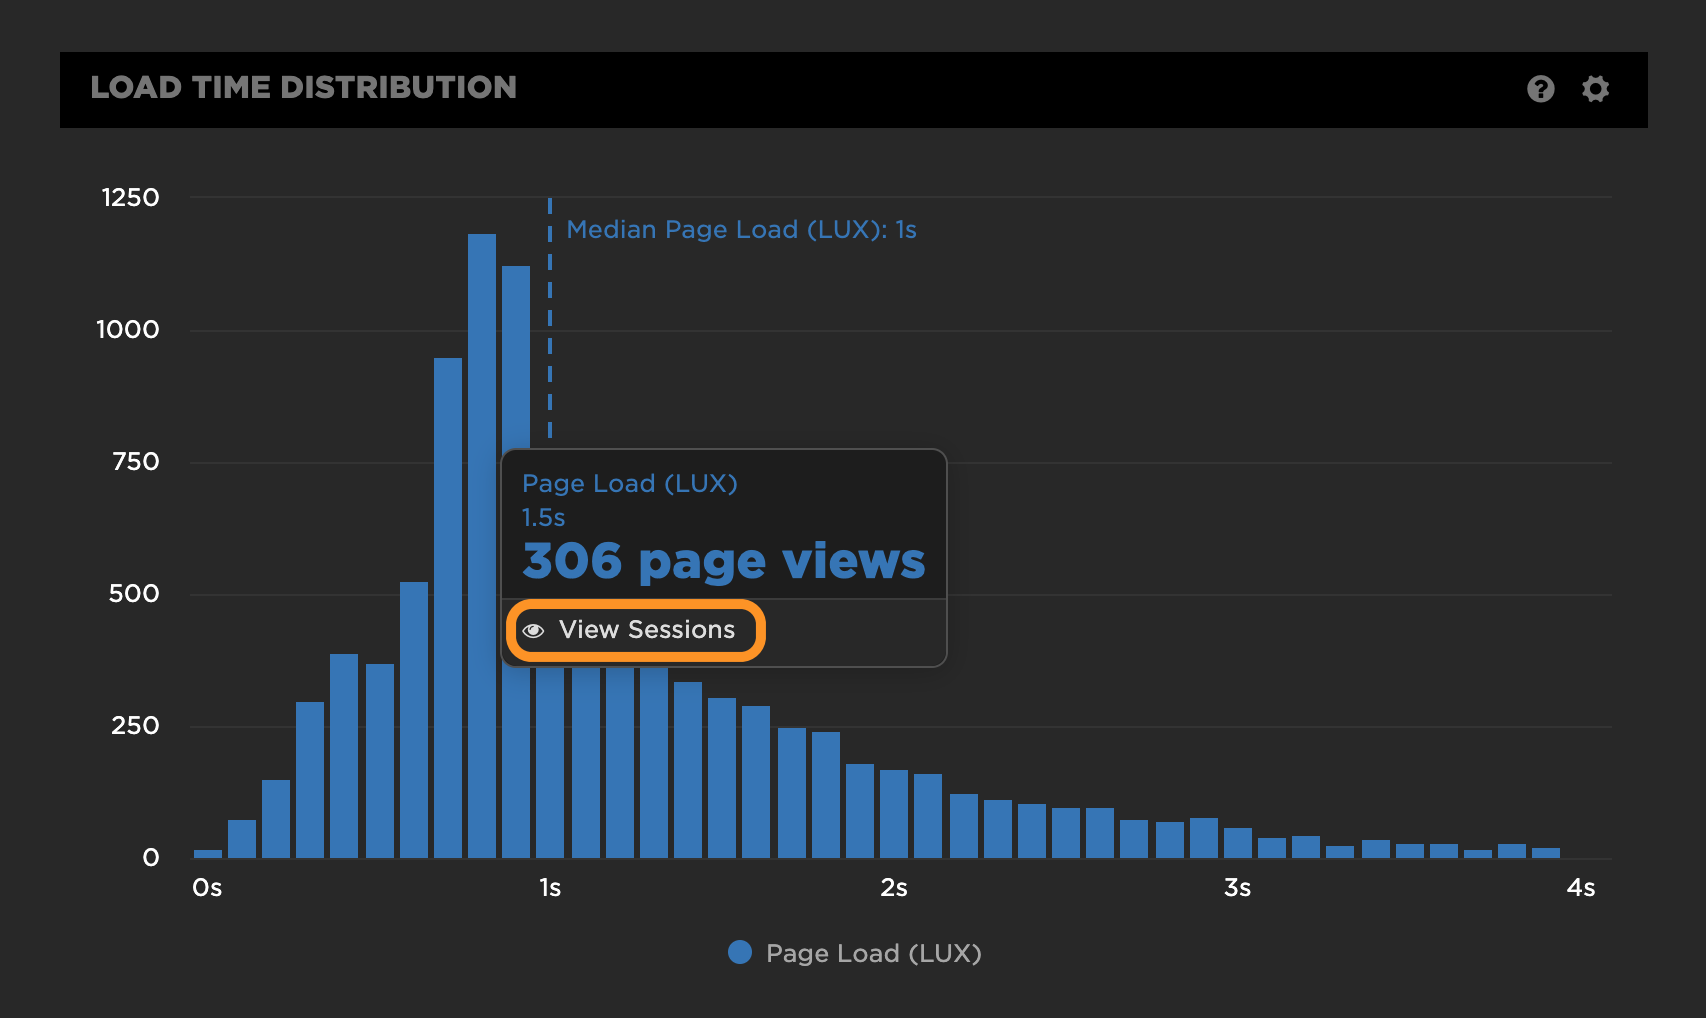
You can also click on a segment of any histogram to navigate to the Sessions dashboard.
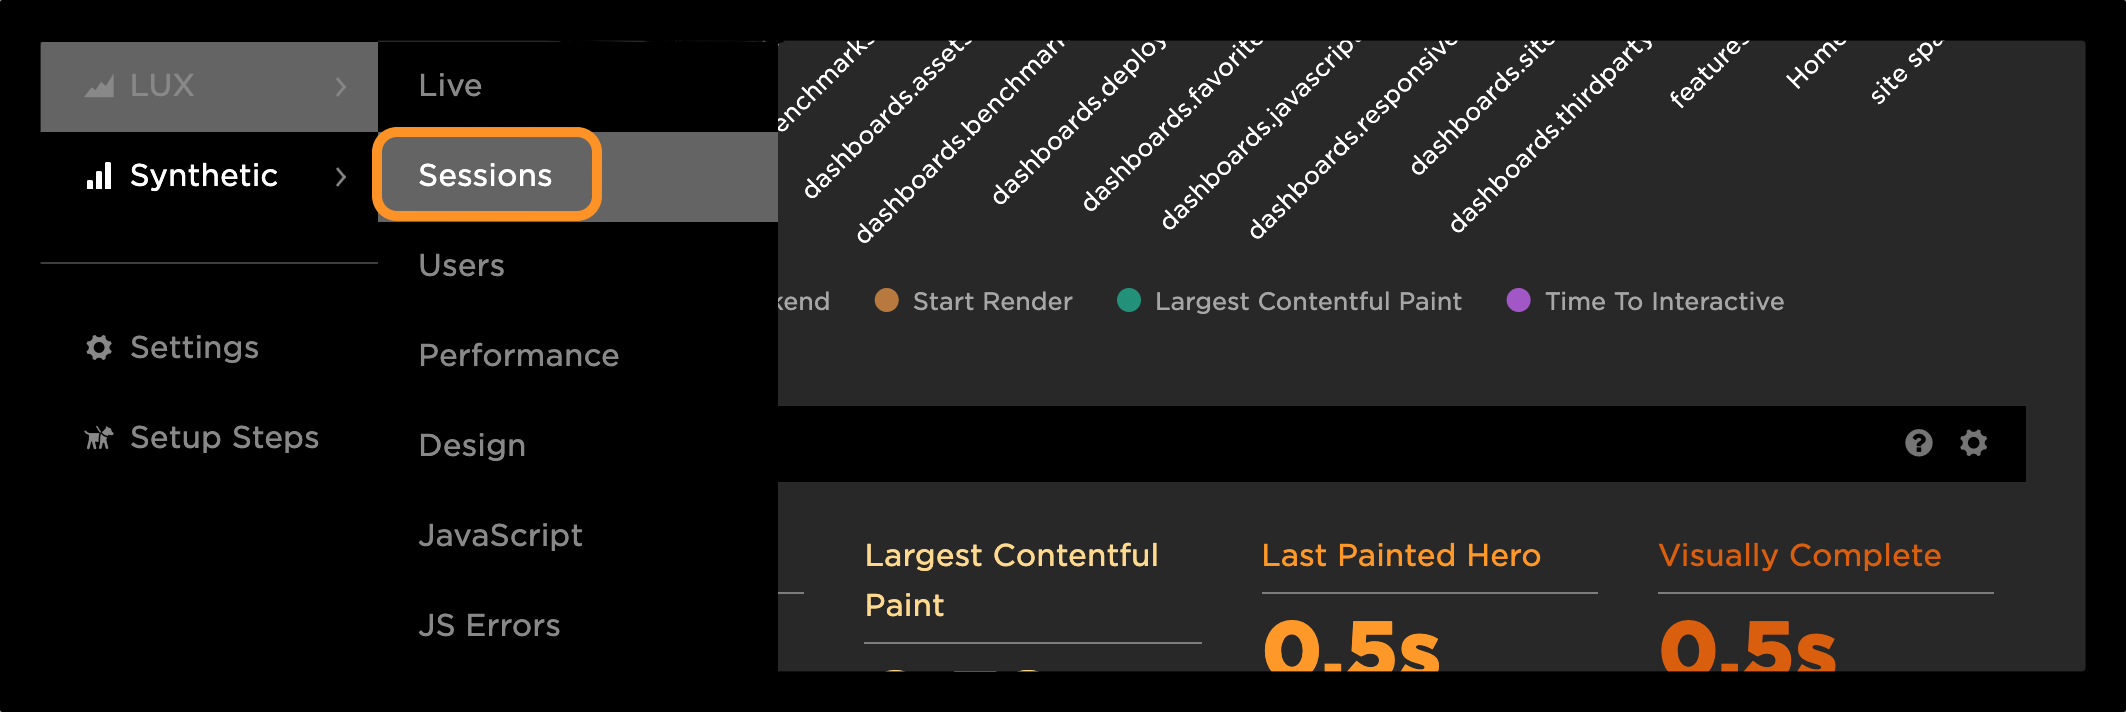
Finally, you can navigate directly to the dashboard by clicking on the Sessions option in the RUM dashboards navigation menu.
Step 2: Explore the Sessions dashboard
When you are taken to the Sessions dashboard, it's important to remember that any filter that was applied to the datapoint you clicked on in Step 1 is also applied to this dashboard. The dashboard is broken into several components to help you understand the make up of users.
The first component includes a histogram of page views which defaults to the metric from the datapoint you selected.
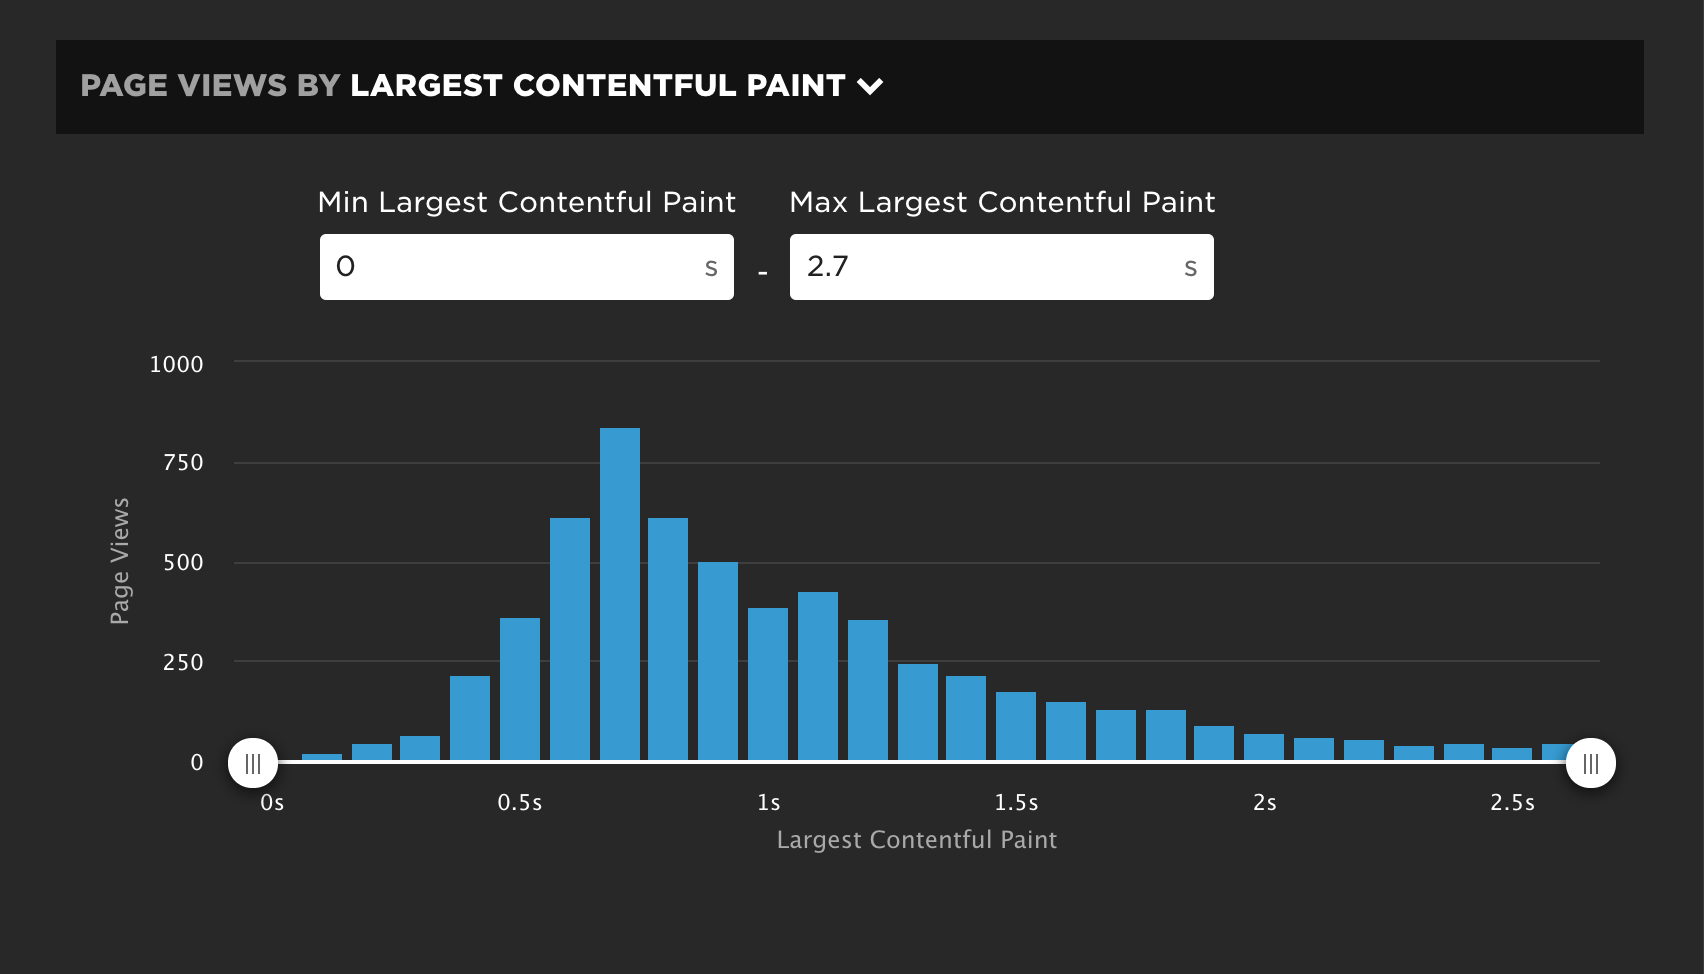
Histogram with sliders for selecting groups of page views with a given performance.
You can adjust the sessions you want to look at by using the sliders on the histogram and clicking 'APPLY'. For example, the following would allow you to look at all sessions where the Largest Contentful page for a page was between 1 and 2 seconds.
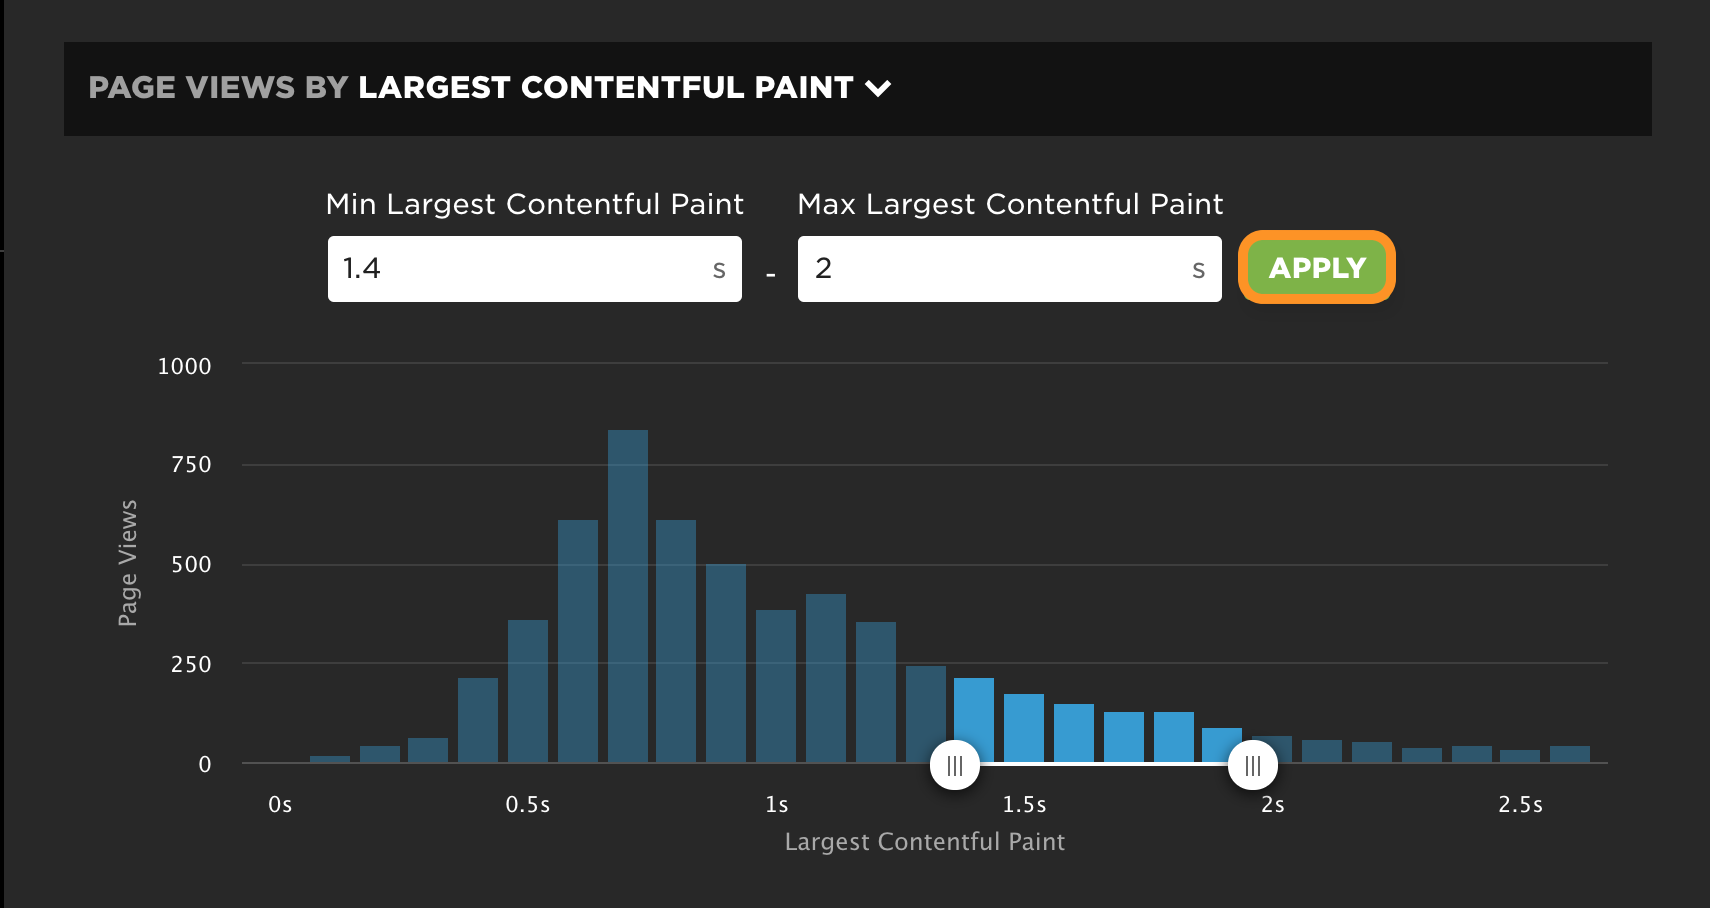
Adjust sliders and click on 'APPLY' to filter to sessions containing page views selected.
The overview section shows you the high-level summary for the sessions you've selected. The smaller numbers to the right of each metric indicate the change from the previous period.

Sessions summary
You can explore the world map to see which countries your users are visiting from. The right column show how the traffic volume has changed from the previous period (red=less traffic, green=more traffic).
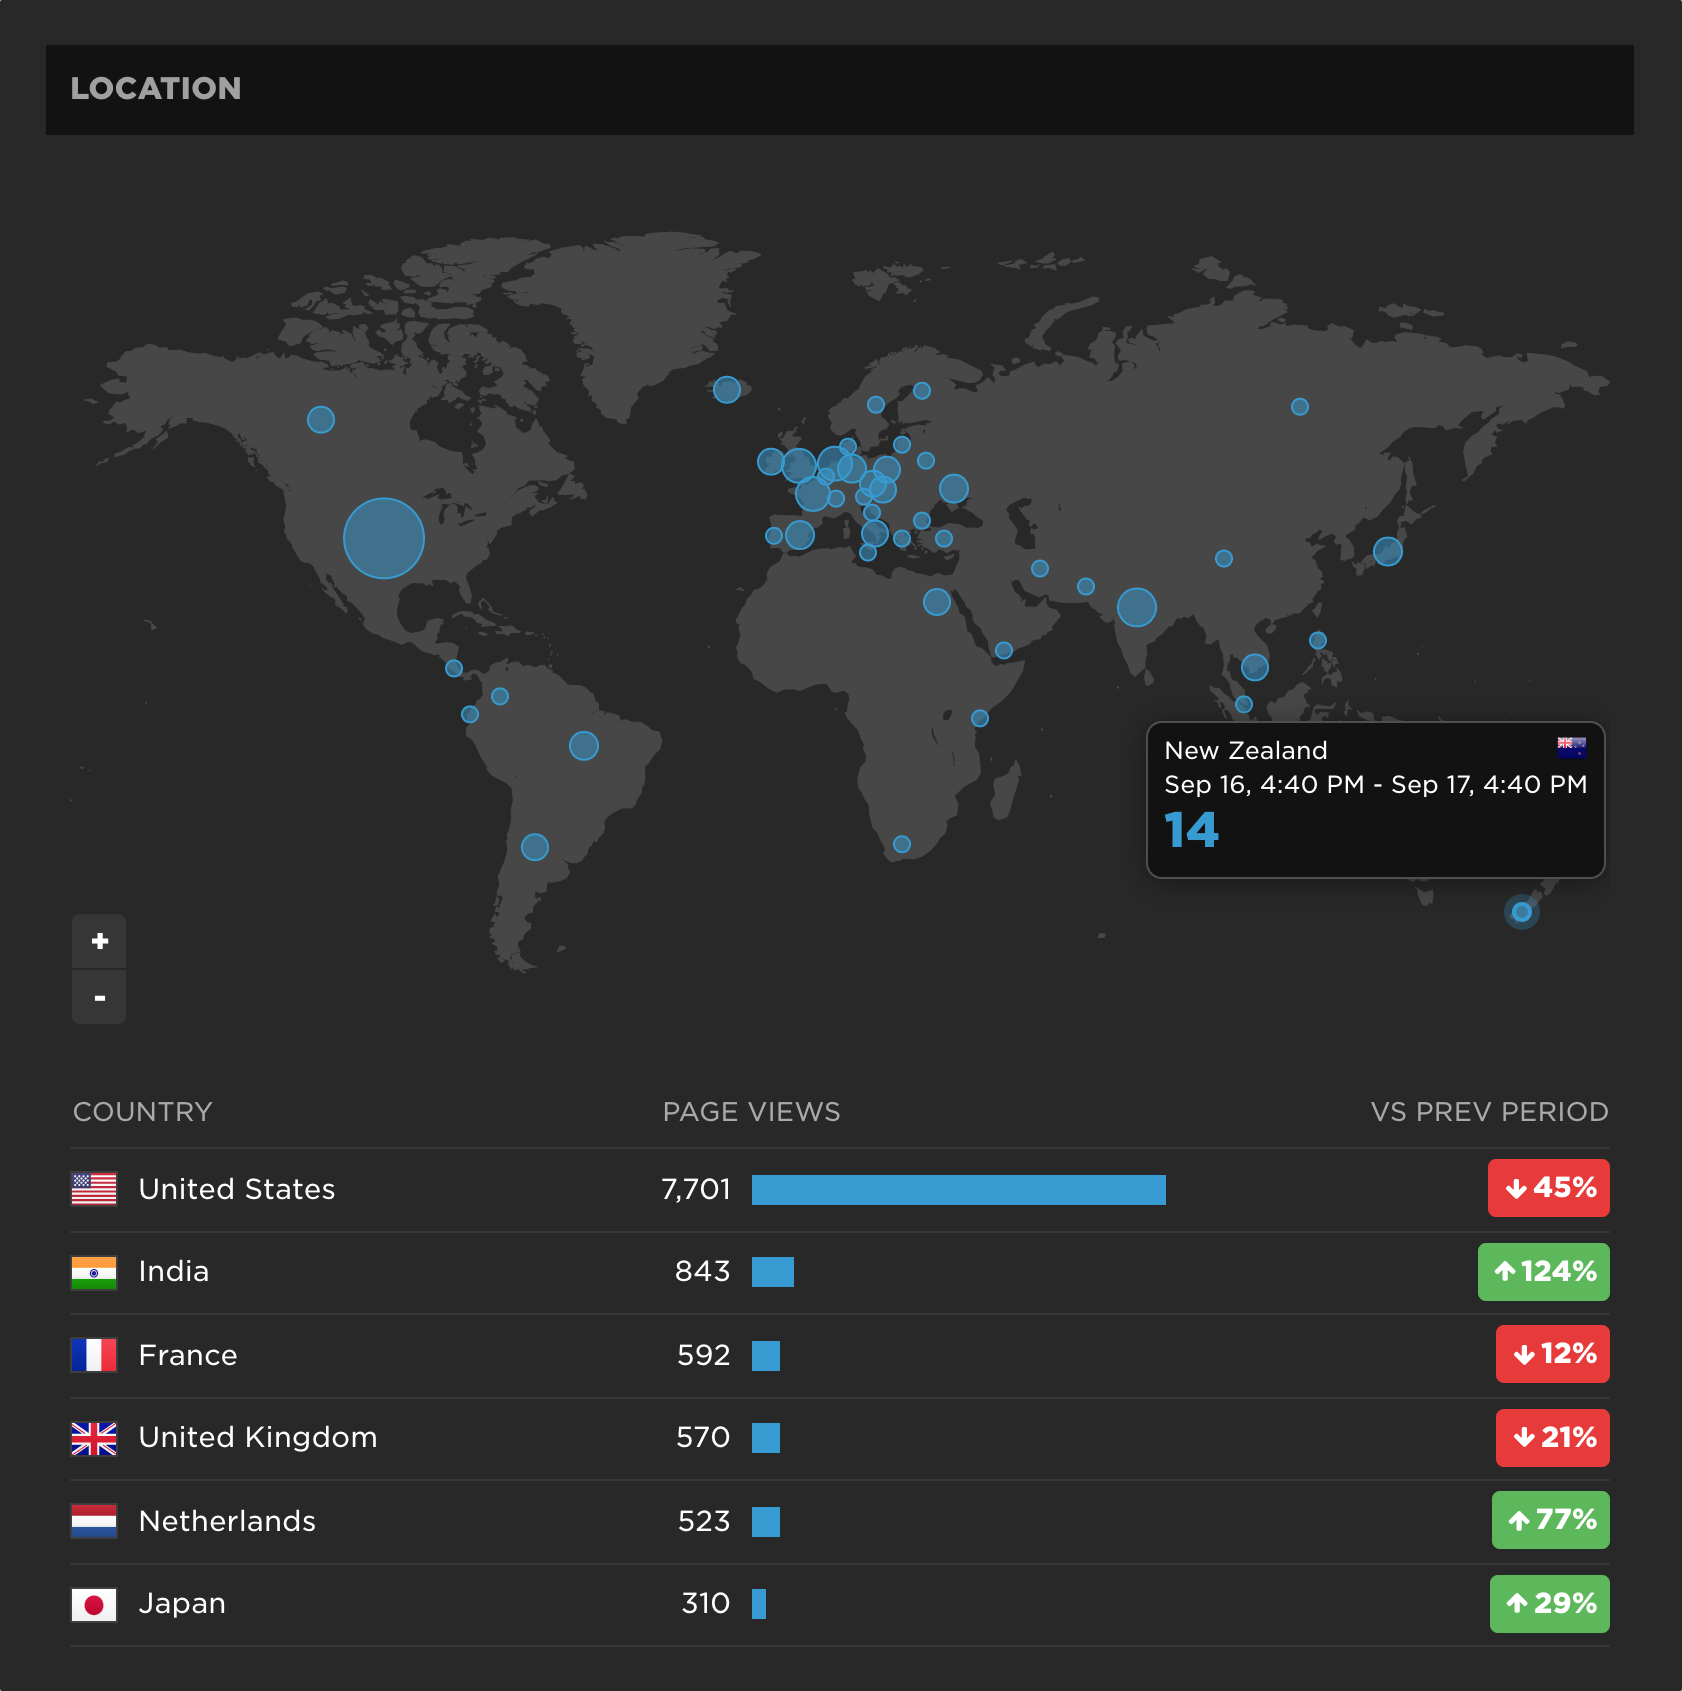
The location map highlights the specific geography of your users.
The User Happiness component shows the latest breakdown of Happy, Okay and Unhappy page views for the period and sessions you've selected.

Learn more about User Happiness
In the next table, you will see a breakdown of sessions by Browser. You can look at other breakdowns across multiple dimensions by selecting from the dropdown. This allows you to evaluate what (if any) changes have occurred across various segments from the previous period.
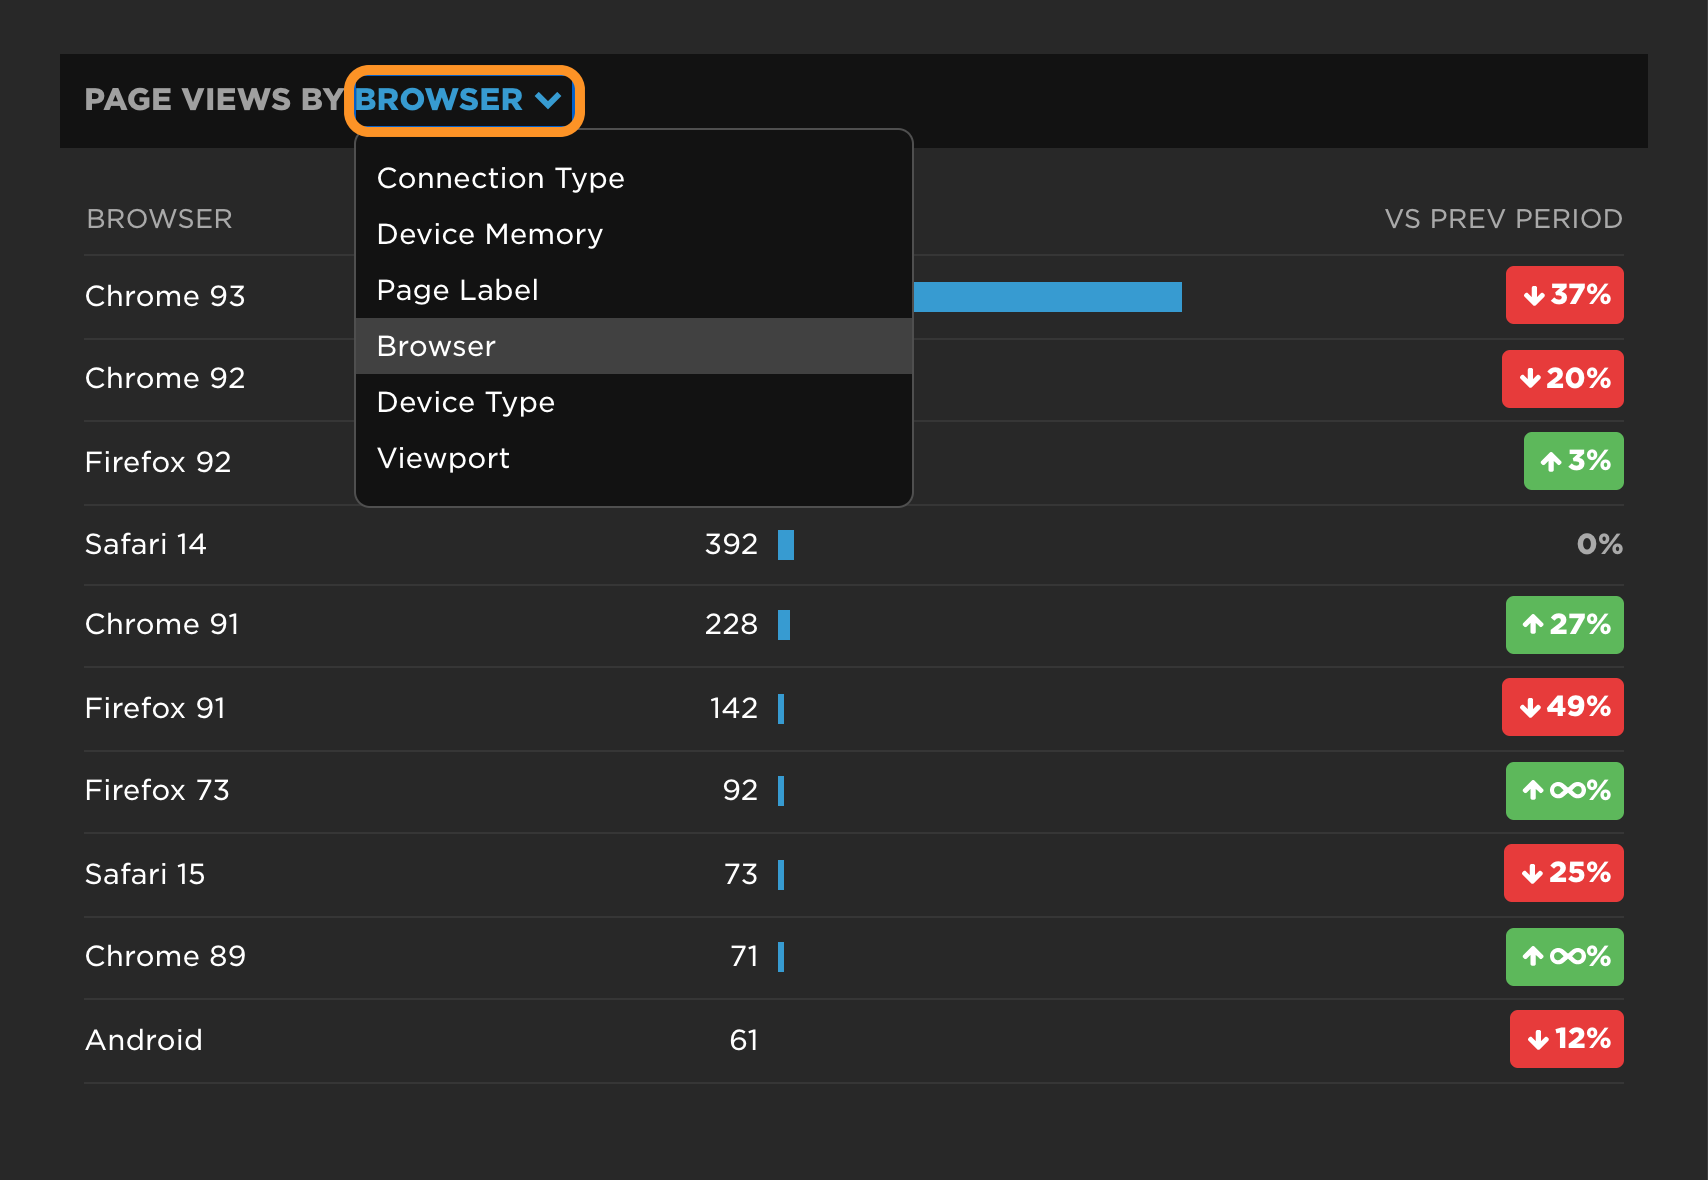
Explore the demographics of your users across several dimensions.
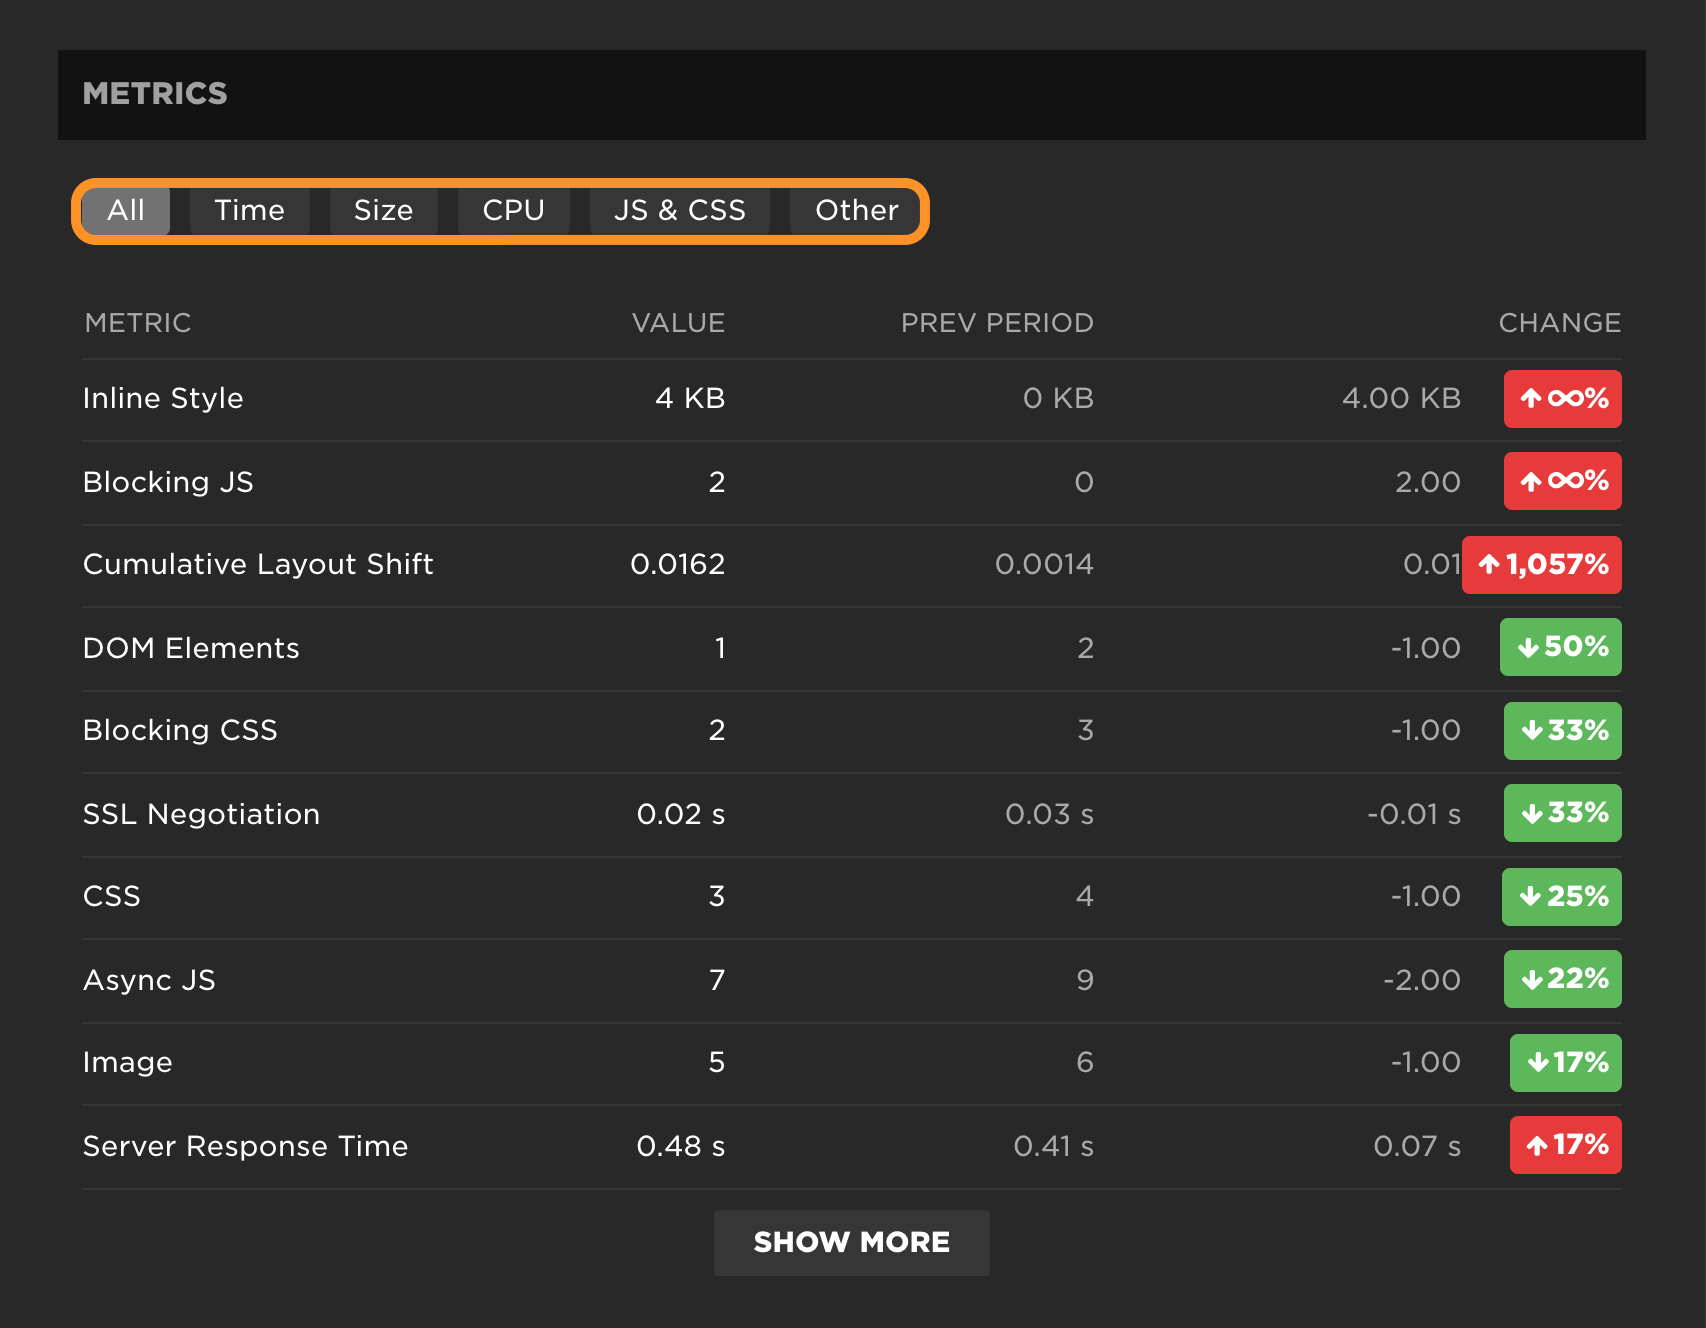
The metrics table breaks down the values and change from the previous period. You can select 'All' or chose from a category to explore.
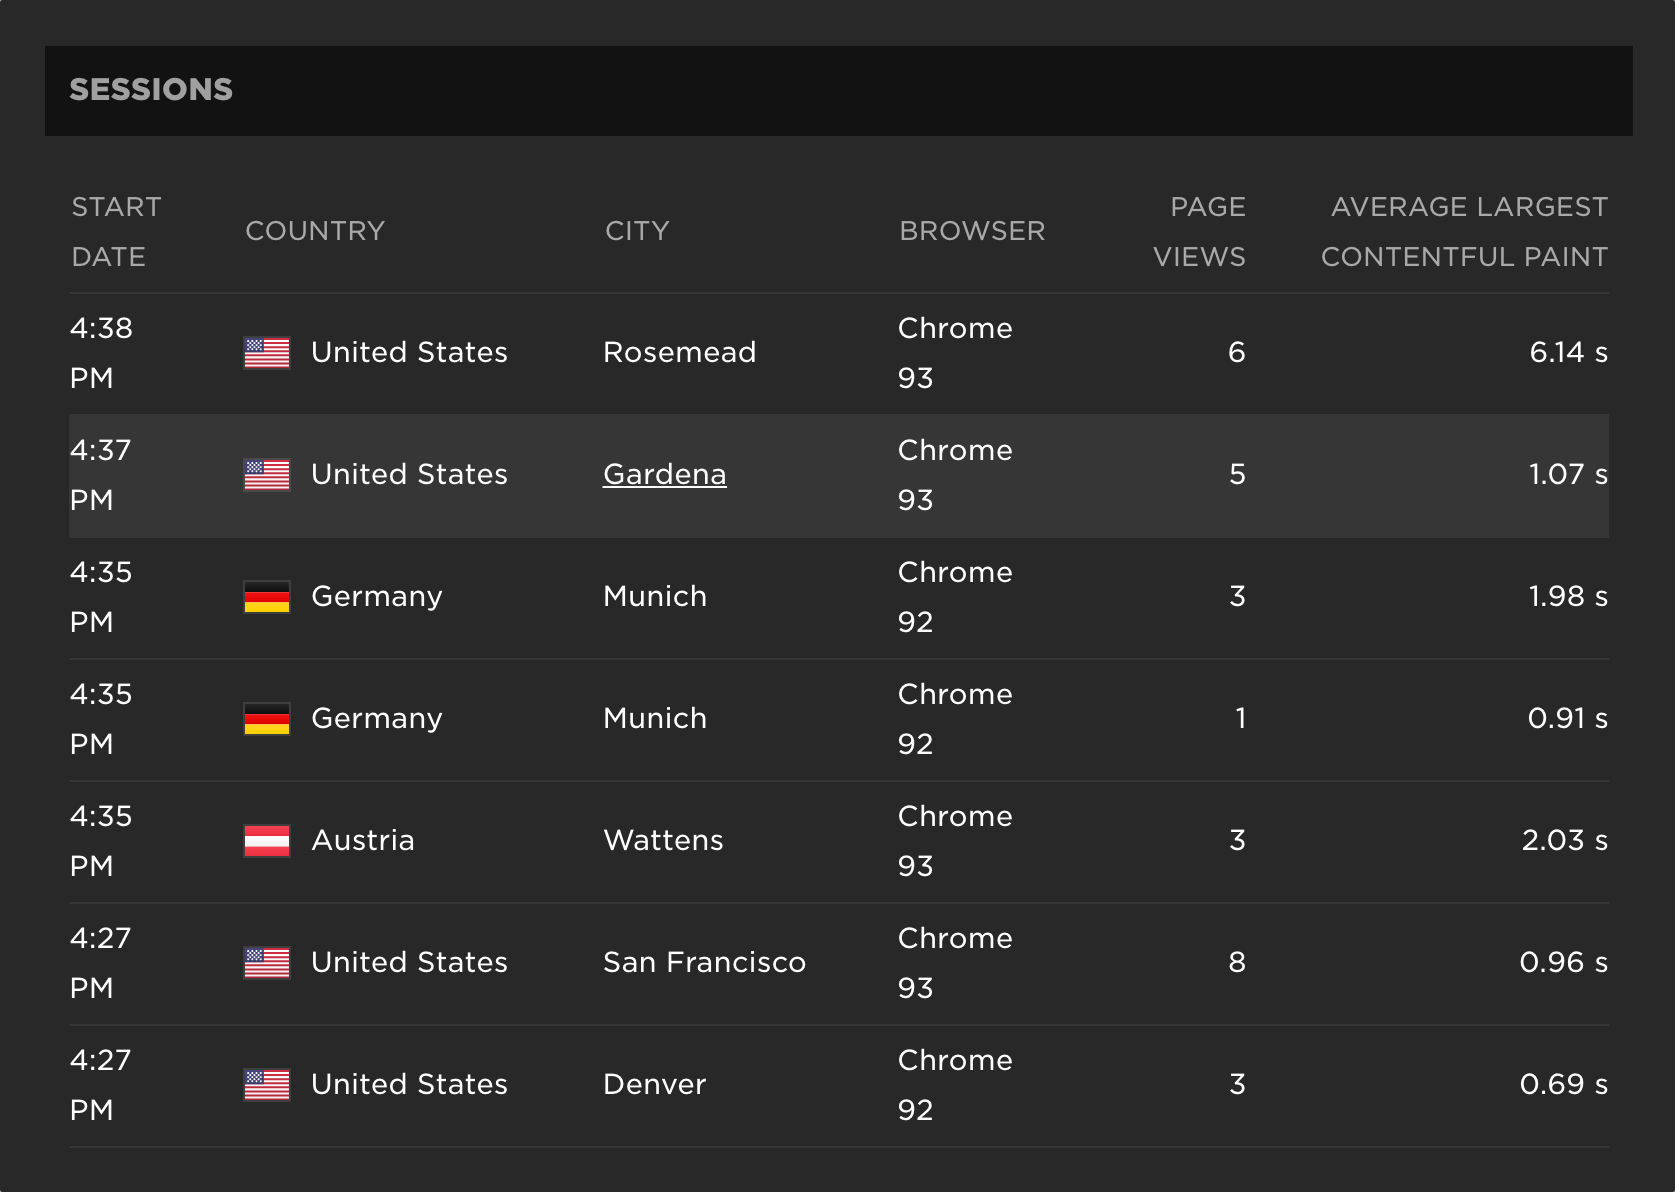
Finally, the Sessions table lists out the most recent sessions in the time period selected including the Date, Country, Browser, number of pages in the session and average value for the selected metric.
Step 3: View session details
If you click on any of the sessions in the table above, you'll be taken to a Session Details view. All of the information in this dashboard is specific to that individual session.
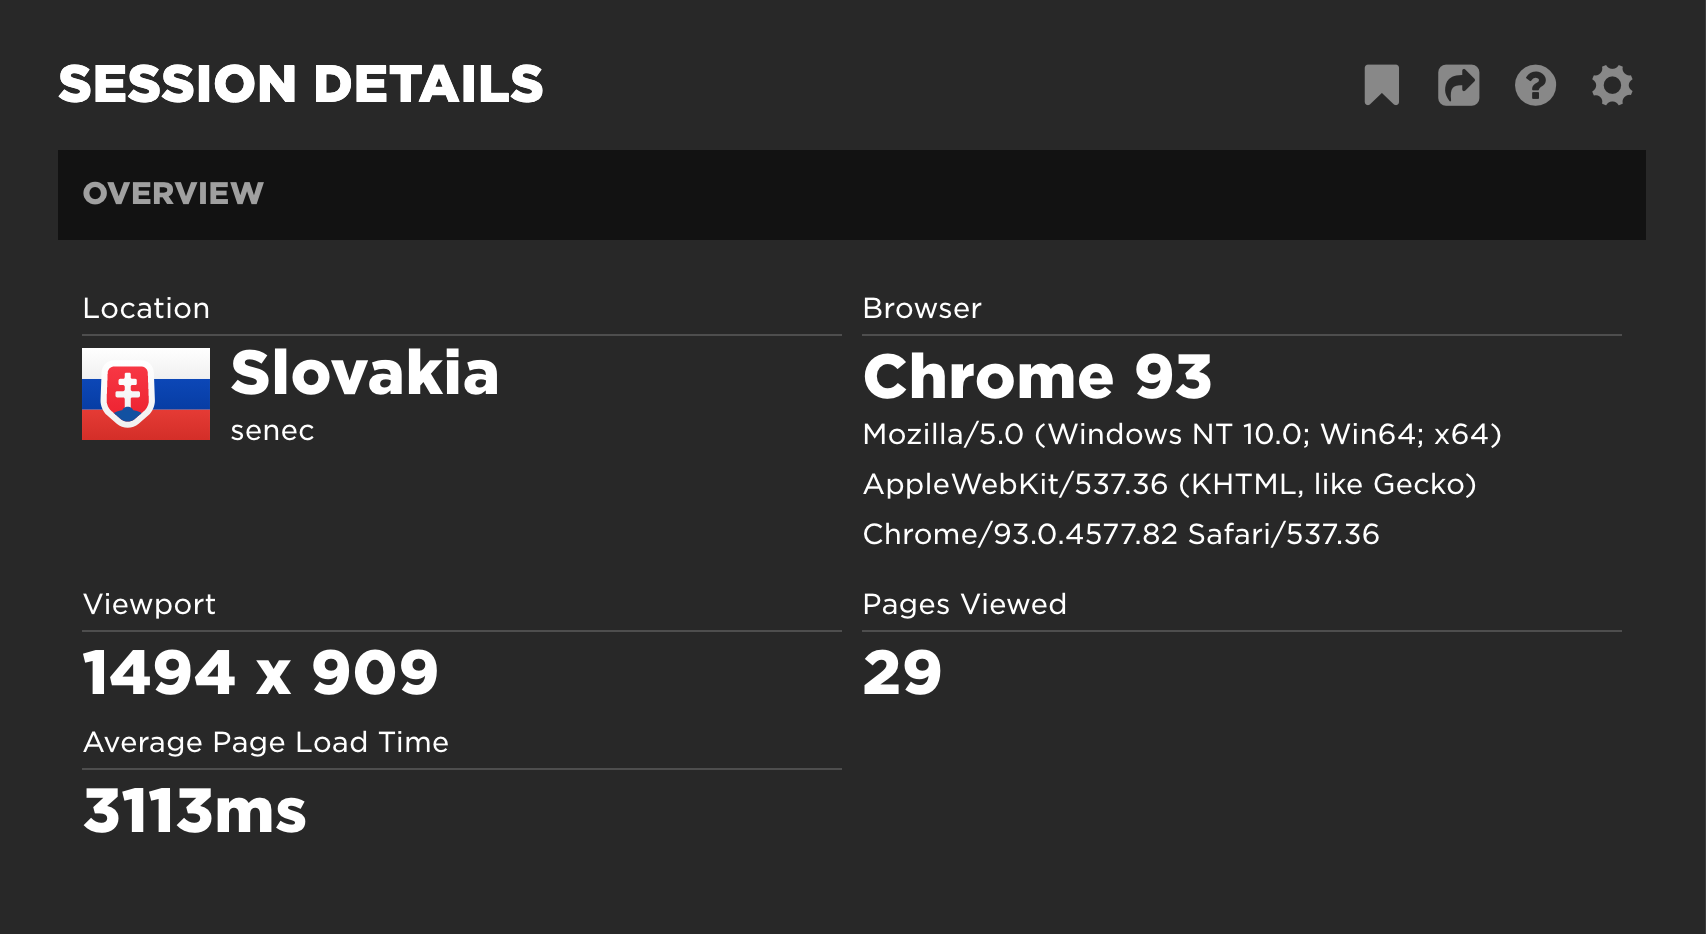
Overview information for the individual session selected.
More details are provided in the Session Details section including a page by page user journey with high-level waterfalls for each page.
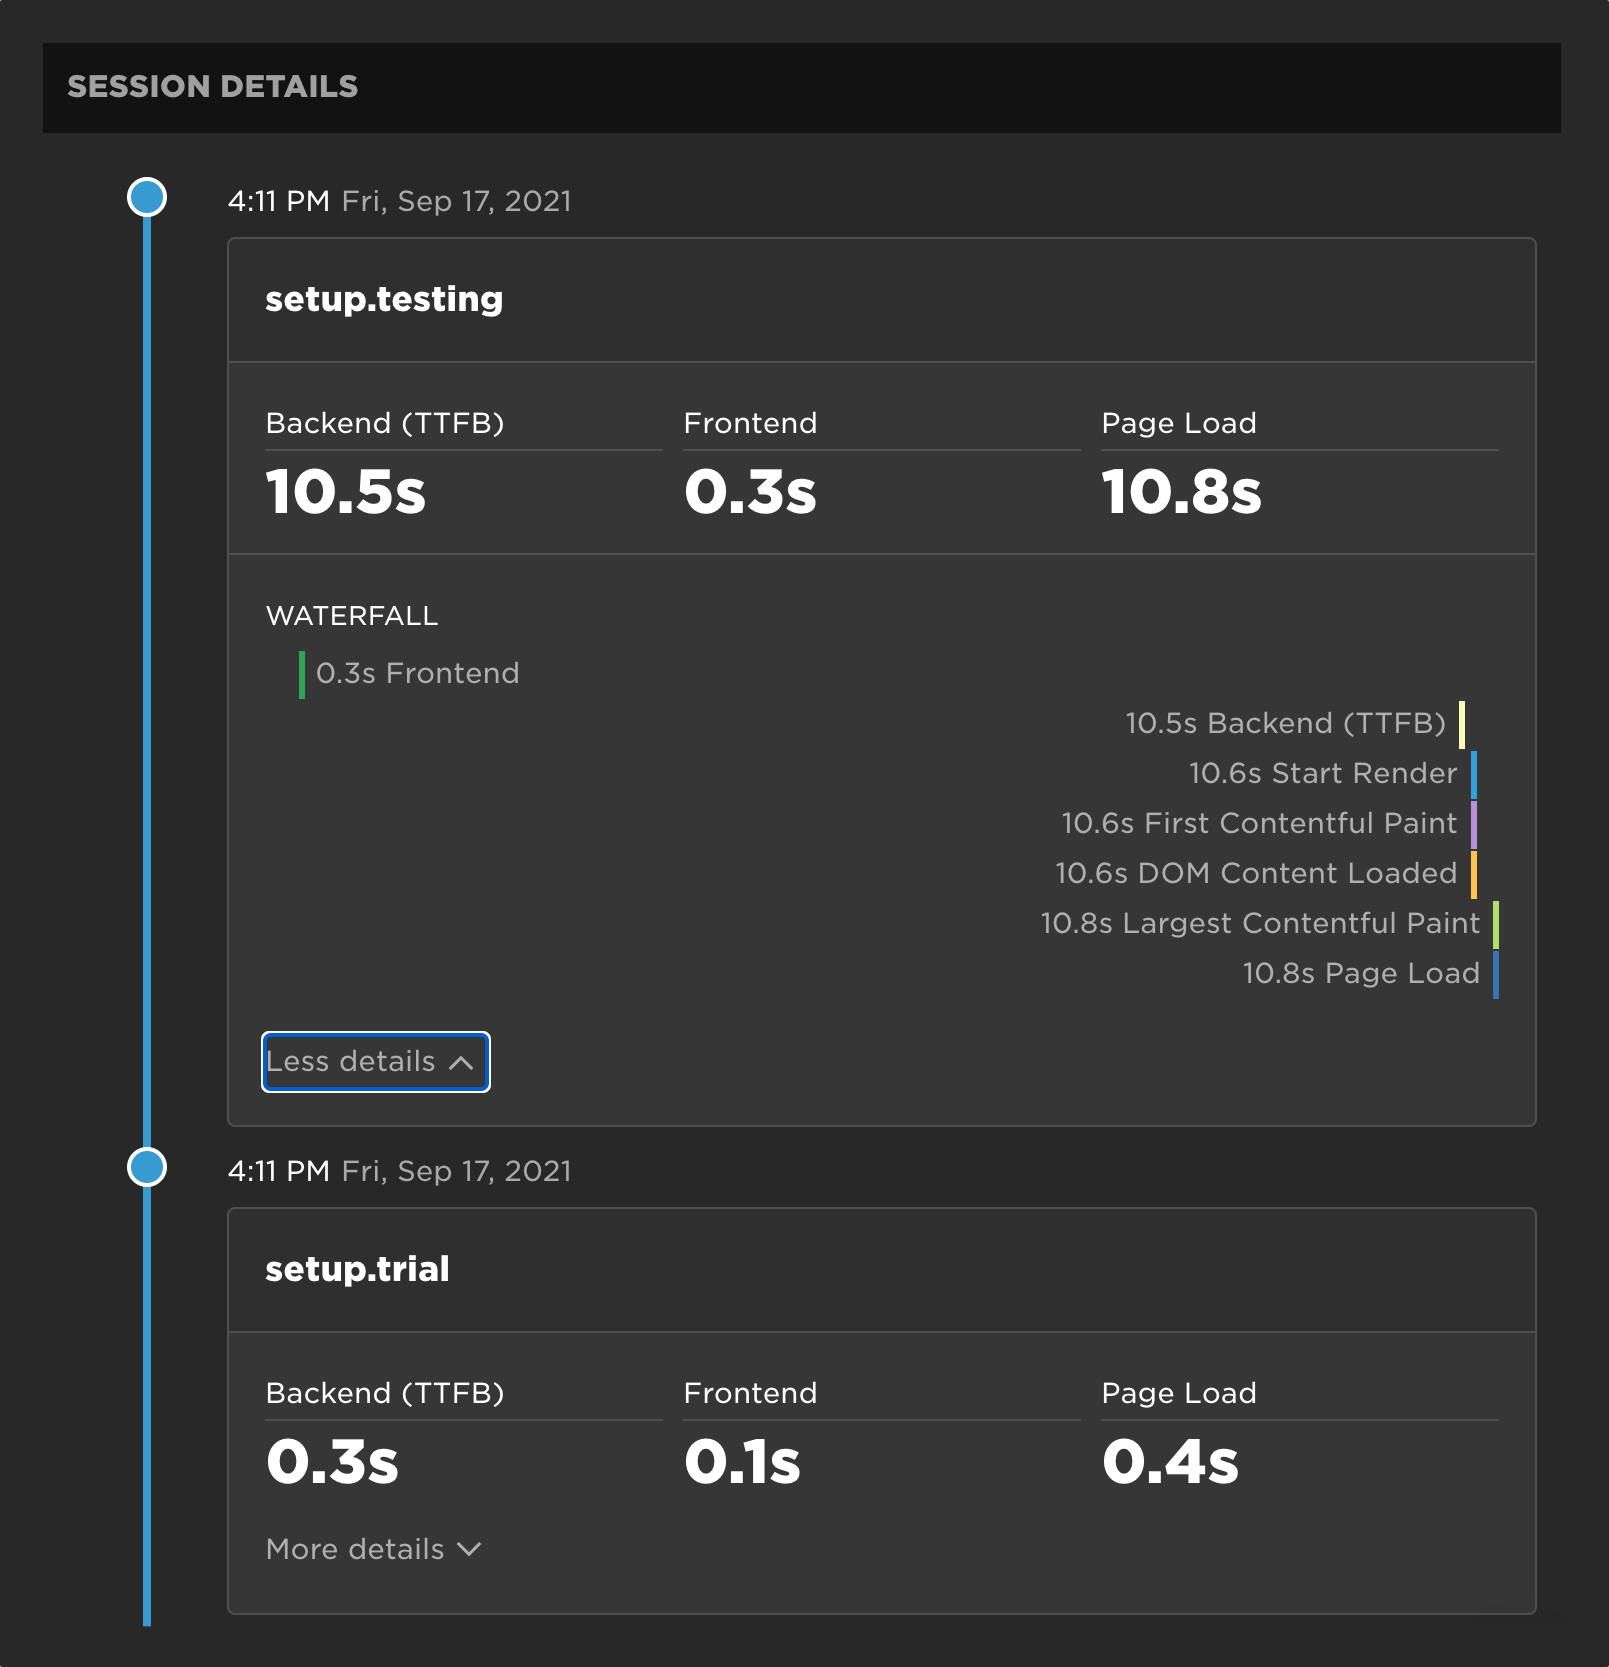
Page by page user journey.
Videos
Interested in learning more? Check out these videos:
Updated 6 months ago