Hero Rendering Times
How we identify the hero rendering metrics, plus how to add element timing.
The key to a good user experience is quickly delivering the content your visitors care about the most. This is easy to say, but tricky to do. Every site has unique content and user engagement goals, which is why measuring how quickly critical content renders has historically been a challenging task.
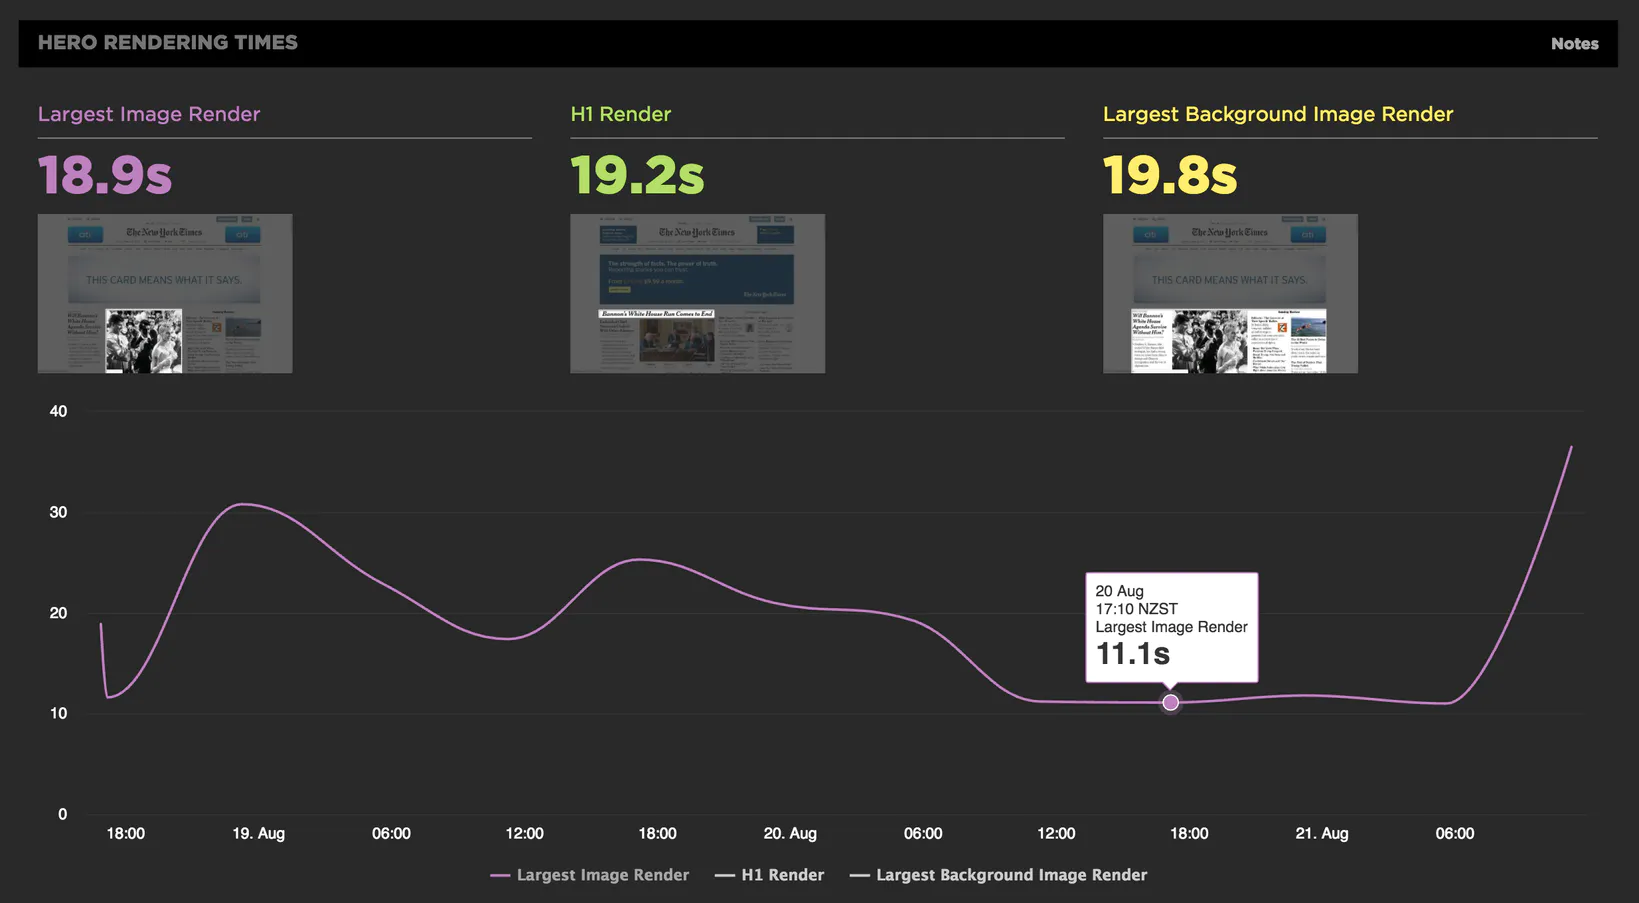
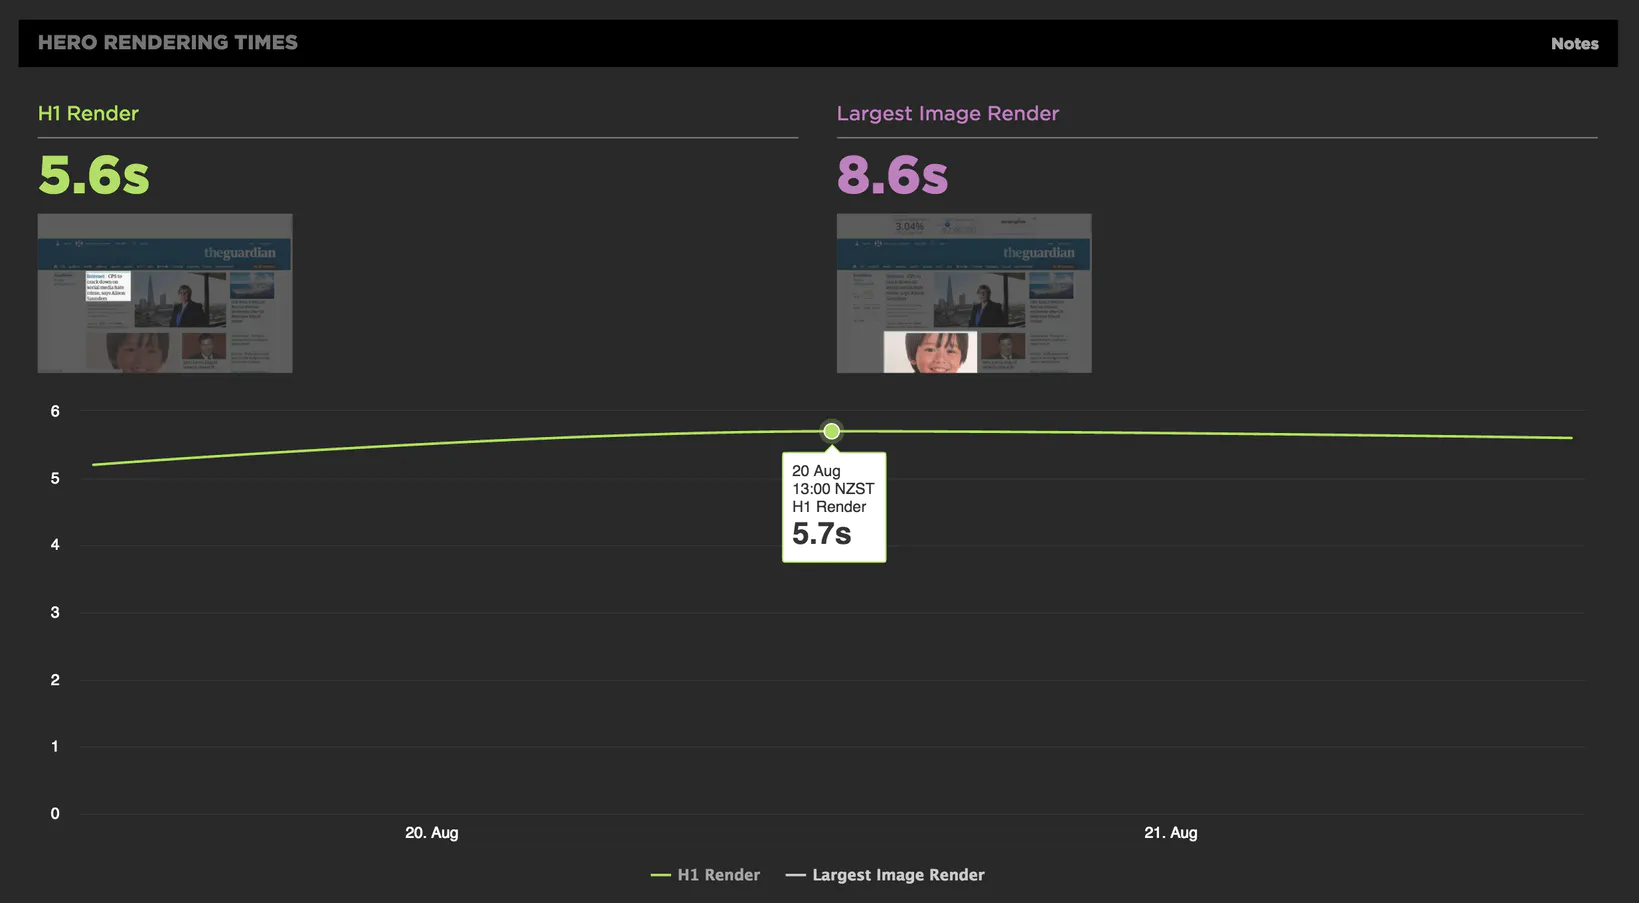
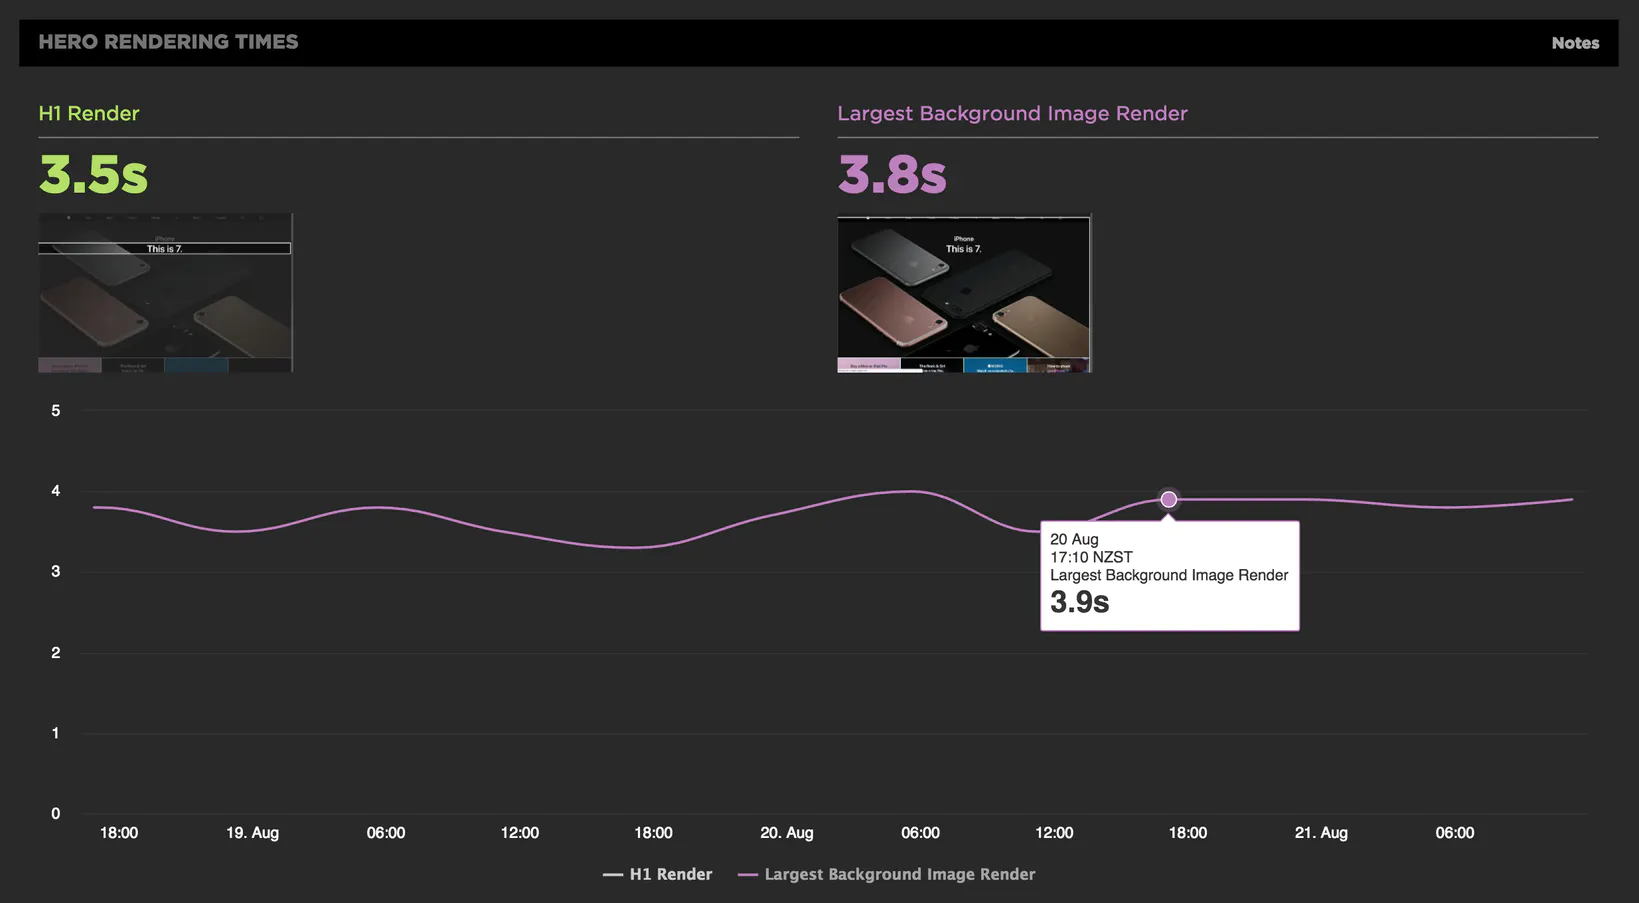
Hero Rendering Times are a set of metrics for measuring the user experience. Hero Times measure when a page's most important content finishes rendering in the browser.
These core Hero Rendering Times are available in your Sites dashboard. You can also track and set performance budgets for them, in your Favorites dashboards.
Largest Image Render
Just as its name suggests, Largest Image Render identifies when the largest image in the viewport finishes rendering. This metric is especially relevant to retail sites, where images on home, product, and campaign landing pages are critical elements.

H1 Render
H1 Render measures when your first H1 element finishes rendering. This metric is especially useful to media and informational sites. Because the H1 tag is usually wrapped around header copy, there's a reasonable assumption that this is copy you want your users to see quickly.

Case study: How NerdWallet used H1 Render Time to help improve font loading by up to 30%
Largest Background Image Render
For some pages, the background image is just as – or more – important than the largest image. We created this metric to ensure that you're not missing out.

"Why am I seeing slower hero rendering times than I expected?"
There are a couple of limitations to how we capture visual rendering time, as the analysis we do is based on the final frame of the filmstrip. Here are a few reasons why you might see rendering time that are slower than you expected:
Layered elements
One limitation of hero rendering times is that they are affected by elements over the top of an image. When doing the visual analysis we use the last frame of the filmstrip as the final state of the page, we then crop down to the area of the image or H1 and use that to search across the filmstrip and find which time first matches that final state of the page.
This means that when elements are layered over the top of each other the rendering time we capture is for the combination of visual elements.
Moving elements
When looking for a visual match for rendering times we also take into account its position on screen so if an element moves around the screen that can delay the time we report.
Elements that move around in the page as it renders can be distracting for users so may want to look at stopping the H1 moving around which would also improve the rendering time we capture.
Elements must be in the viewport
Hero rendering times are calculated by performing a frame-by-frame analysis of the filmstrip. This means that only elements visible in the viewport can be measured. Any hero elements outside of the viewport will be ignored and SpeedCurve will not measure their rendering times.
Hero Element Timing
Default metrics are important to have – not least because they're based on universal page elements, which means you can use them to compare your site to your competitors. But chances are you want to get a more nuanced look at hero elements that are unique to your site, your pages, and your users. This is where Hero Element Timing comes in.
Hero Element Timing – which is based on the Element Timing API – lets you select and annotate specific hero elements on your pages, such as search boxes, image carousels, and blocks of text.
Right now, you can follow the instructions in the API spec to annotate your pages, and see the results in your SpeedCurve results. (As a bonus, when browsers inevitably catch up and adopt the spec, you'll be ahead of the game.)
<div elementtiming=”foobar” class=”...” >
Updated 6 months ago